While nearly 3bn people have little or no wealth at all
Just 56m or 1% of adults out of 5.3bn globally are millionaires in net wealth terms. And they own 45% of all global personal wealth. The other 99% own the rest and there are nearly 3bn people in the world that have little or no wealth at all (after debts are deducted).
Every year I report on the results of the annual Credit Suisse Global Wealth Report. Produced by economists Anthony Shorrocks (with whom I graduated at university), James Davies and Rodrigo Lluberas, this is the most comprehensive study of global personal wealth and inequality between adults around the world.
In the 2021 report, the economists find that the global wealth gap widened during the Covid pandemic, swelling the ranks of the world’s millionaires by 5.2 million as the rich cashed in on surging stock and house prices. I quote “During the pandemic, emergency interest rate cuts and government stimulus measures often benefited those least in need of state support, helping their assets grow in value despite the economic downturn.”
The report finds that dollar millionaires now account for more than 1% of the global population for the first time in history: 56.1 million individuals had assets worth more than $1m (£720m) in 2020. That compares with the mean average wealth per adult in the world of just under $80,000.
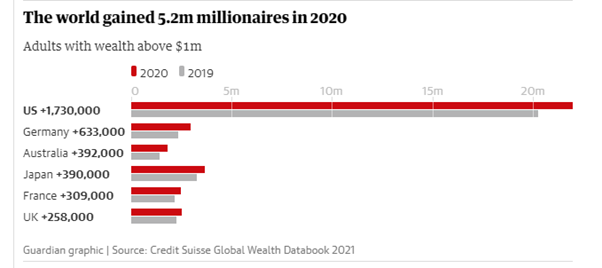
In total, global wealth grew by 7.4% in 2020 to $418.3tn in 2020, with gains largely attributed to growth in the US, Europe and China, while overall wealth in Latin America and India declined.
Global wealth is expected to rise a further 39% over the next five years to reach $583tn by 2025, while the number of millionaires is forecast to jump by nearly 50% to 84 million individuals. The group rich enough to be counted as ultra-high net worth is also expected to expand by nearly 60% to reach 344,000 people.
Total global wealth grew by 7.4% and wealth per adult rose by 6% to reach another record high of $79,952. The report finds that “overall, the countries most affected by the pandemic have not fared worse in terms of wealth creation. In short, there is nothing in the chart to suggest that the economic upheaval in 2020 bore any resemblance to that experienced in 2008. Household wealth appears to have simply continued on its way, paying little or no attention to the economic turmoil that should have hampered progress.”
Aggregate global wealth rose by $28.7 trillion to reach $418.3 trillion at the end of the year. That compares with annual global GDP of about $100trn, so some four times larger. In terms of current US dollars, total wealth grew by 7.4% and wealth per adult was up 6.0%. However, widespread depreciation of the US dollar accounted for 3.3 percentage points of the growth. If exchange rates had remained the same as in 2019, total wealth would have grown by 4.1% and wealth per adult by 2.7%.
Global average wealth per adult in the year 2000 was $31,378. So, without making allowance for inflation, average wealth is now 2.5 times its value at the start of the century. Where is this extra wealth being accrued? North America and Europe accounted for the bulk of the wealth gains in 2020. Total wealth scarcely changed in Africa, and exchange rate appreciation accounted for what little change there was. India and Latin America both recorded losses in 2020. Total wealth fell in India by 4.4%. Latin America appears to have been the worst-performing region, with total wealth dropping by 11.4% or $1.2 trillion. With these regions being stricken most by the pandemic, this is no surprise.
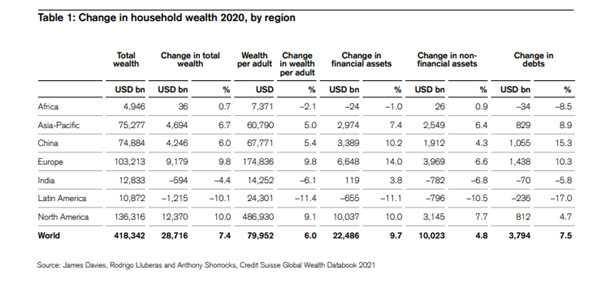
The change in wealth per adult is a better guide to the comparative performances of different countries. On this measure average wealth per adult rose most in Switzerland and Australia. Asset price rises played a role in some of these countries, most notably the United States. But currency appreciation is the main explanation for most of these increases in average wealth. That means national currencies appreciated against the US dollar to raise dollar wealth.
A key figure in the report which I always show is the wealth pyramid. It summarizes the distribution of wealth among all global adults. The report reckons that that 2.9 billion individuals – 55% of all adults in the world – had wealth below $10,000 in 2020. The next segment, covering those with wealth in the range of $10,000–100,000, has seen the biggest rise in numbers this century, more than trebling in size from 507 million in 2000 to 1.7 billion in mid-2020. This reflects the growing prosperity of emerging economies, especially China.
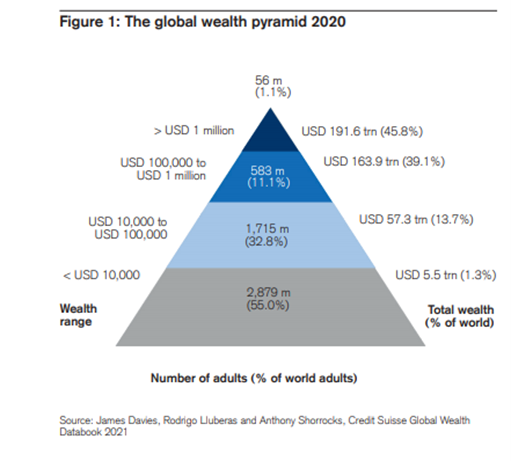
In 2020, if you have personal wealth (financial assets plus property less debt) of over $129,000, you are in the top 10% of global wealth holders and if you had over $1m in wealth, you are in the top 1% in the globe. What that tells you is that there are billions of people with little or no wealth (financial and property) in the world. Inequality of wealth is extreme.
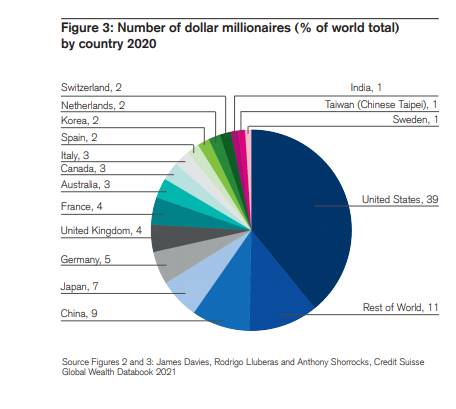
The US has by far the greatest number of millionaires: 22.0 million, or 39.1% of the world, far ahead of China, which is in second place with 9.4% of all global millionaires.
What about the super-rich, the uber rich with over $50m in wealth? There are over 215,000 people in this bracket – the rulers of the rest of us 7.9bn people. They saw the biggest rise in their wealth during the pandemic. As the report’s authors say: “it is particularly striking in a year experiencing social and economic turmoil. The nature of the policy response to the pandemic has of course been a major influence here.”
As I have argued in various posts before, not enough attention is paid to inequality of wealth compared to inequality of incomes, either within a country or globally. https://thenextrecession.wordpress.com/2020/07/15/wealth-or-income/
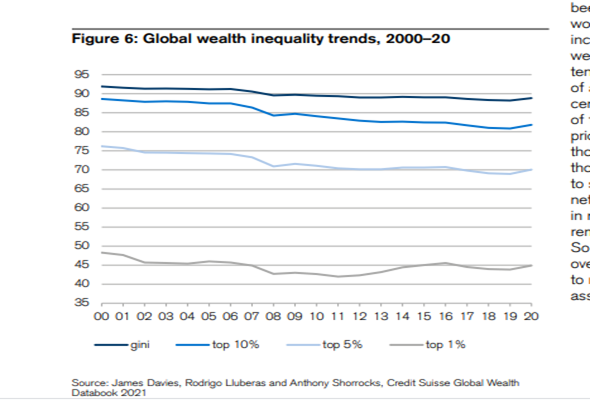
As the CS report says, wealth inequality is much more unequal. “By any standard, wealth inequality is high in all countries and exceptionally high in some. As a rough guide, typical values would be 35% for the share of the top 1% and 65% for the share of the top 10%.” The gini inequality measure is used to measure overall inequality in incomes and wealth. In wealth, gini values are much higher than the corresponding values for income inequality or any other standard welfare indicator. As I have shown before, Brazil, South Africa and Russia lead the world in wealth inequality and among the advanced economies, the US is the most unequal of all.
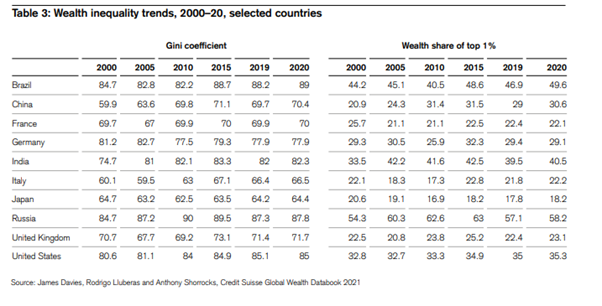
If we look at those at the bottom of the wealth league, the CS economists estimate that the bottom 50% of adults in the global wealth distribution together accounted for less than 1% of total global wealth at the end of 2020. In contrast, the richest decile (top 10% of adults) owns 82% of global wealth and the top percentile alone has nearly half (45%) of all household assets. These ratios have hardly changed in 20 years.
China has made by far the biggest contribution to the growth in wealth this century. The CS economists reckon that “between now and 2025, we envisage that China will account for more than a quarter of the rise in household wealth recorded for the whole world.” And that will mean that “China’s wealth per adult in 2025 will qualify it as a “high-wealth” country in our classification scheme. China began this century with wealth averaging $4,250 per adult, placing them in the lowest of our country wealth categories. Transiting to the highest of our wealth categories within a 25-year timespan would be an extraordinary achievement by any standard.”
Global financial wealth has exceeded non-financial wealth in every year this century except 2008. It’s speculation in financial markets that has made the super-rich even richer. For example, the latest figure for the US for financial wealth inequality is truly staggering. The richest 1% of US households now own 53% of all equities and mutual funds held by American households. The richest 10% own 87%!
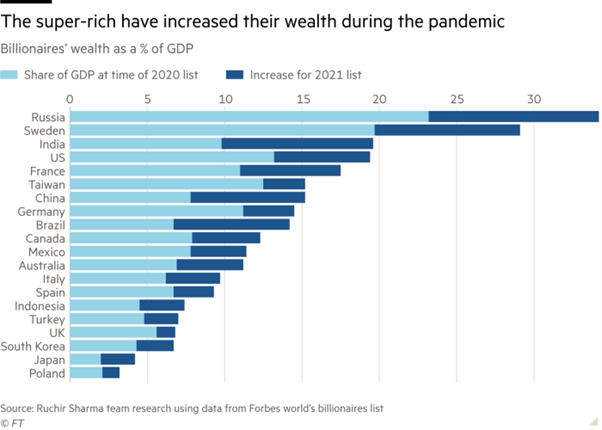
Indeed, as another study shows, the super-rich 1% in the globe have increased their wealth hugely during the pandemic, particularly in places where households have suffered most from the impact of the pandemic, like Russia, Sweden, Brazil, India and the US.
It’s the same the whole world over, It’s the rich what gets the pleasure, It’s the poor what gets the blame.
No comments:
Post a Comment