The final estimate of US GDP in the fourth quarter of 2014 came out today. US real GDP growth was left unrevised at 2.2% year-on-year in the final three months of the year and the figure for the whole of 2014 was unrevised at 2.4%. Mainstream economists were keen to suggest that the current quarter in 2015 ending this week could show a pick-up.
But none mentioned the really important development – that corporate profits fell in the fourth quarter, increasing the risk of a new slump in investment in 2015-16. Profits fell $30.4 billion in the fourth quarter, in contrast to an increase of $64.5 billion in the third. This seems mainly due to a fall in profits from overseas as the dollar’s strength drove income gathered in other currencies down. This meant that corporate profits are lower by 0.2% from this time last year and are down 0.8% in 2014 compared to 2013.
In previous posts, I have argued that profits drive investment; and investment leads real GDP growth in capitalist economies – the opposite, by the way, of the causal sequence claimed by the Keynesians, who see it as consumer spending and investment leading to income and thus to profits (see my many posts on this issue, https://thenextrecession.wordpress.com/2012/06/26/profits-call-the-tune/
and the excellent paper by Tapia Granados
http://sitemaker.umich.edu/tapia_granados/files/does_investment_call_the_tune_may_2012__forthcoming_rpe_.pdf).
In 2014, there were clear signs that US corporate profit growth was slowing, see my post
https://thenextrecession.wordpress.com/…/us-gdp-up-but-pro…/.
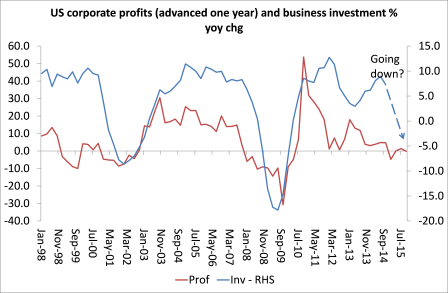
I argued that, when corporate profits slow, some six months to year later, so will business investment. Well in Q4 2014, profits went negative for the first time since the beginning of the Great Recession in January 2008. The time before that was at the beginning of the mild recession of 2001. Now as the graph below shows, that would suggest a new investment slump before the year is out.

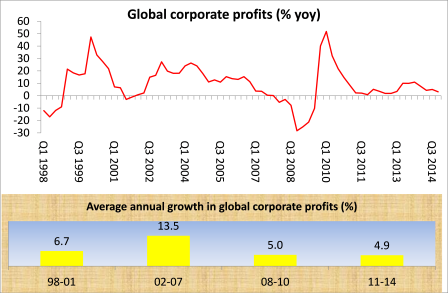
And it is not just US corporate profits. I have been tracking corporate profits in some of the major capitalist economies, namely, the US, UK, Japan, China and Germany. Combined corporate profits growth has been slowing sharply, from 11% yoy this time last year to just 3.2% at the end of 2014. Indeed, corporate profits growth has been very weak since the end of the Great Recession compared to before and now appears to be running out of steam.

This was mirrored by the figures for China’s industrial profits, also out today for the first two months of this year. Profits fell 4.2% from the same period in 2014, the biggest drop since early 2012.
The latest updated figures for the US mean that I can also make a pretty good stab at the movement in the US rate of profit right up to 2014. I have updated the estimate using the same sources, categories and methods adopted in my paper for a ‘whole economy’ rate of profit (see my paper, The profit cycle and economic recession).
For those of you who like to know how I get my results in detail (and there are many of you!), suffice it to say, that I have used the US Bureau of Economic Analysis NIPA accounts. I get the US net domestic income (GDP less capital consumption) and employee compensation from NIPA Table 1.10 and capital stock from the NIPA fixed asset tables 6.1 (for current cost measures) and 6.3 (for historic cost measures). Also, in my rate of profit measure, I include variable capital (employee compensation) in the denominator – something nearly all other analysts do not do. I won’t explain why I differ from others on this now (there is unpublished paper on this by myself and G Carchedi); again suffice it to say that if the rate of profit is measured with just fixed assets as the denominator, it does not make a decisive difference.

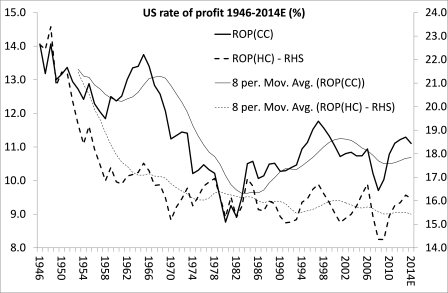
My results show that the US rate of profit fell in 2014, whether measured on a current cost or historic cost basis for fixed assets and depreciation, for the first time since the start of the Great Depression.
In the graph, the data confirm yet again what I and many other Marxist economists have argued (contrary to Thomas Piketty, among others) that the US rate of profit has been in secular decline since the end of the second world war. There was a ‘golden age’ from 1946 to 1965, when profitability held up (at least on the current cost measure) but then there was a period of sharply falling profitability (the crisis period) from 1965 to 1980-2. From 1982 to 1997 there was a significant revival in profitability (on a current cost basis) and a small pick-up, or end to the decline (on a historic cost basis) – the neo-liberal period, if you like. From 1997, US rate of profit entered a downward phase. Since the end of the Great Recession, profitability revived from lows in 2009 but is still below the level reached in 1997. And it fell in 2014.
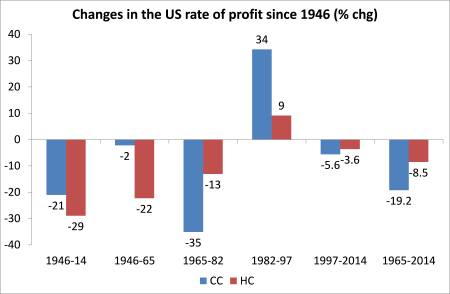
From the data, we can see in more detail how profitability has changed. Between 1946 and 2014, US profitability in the capitalist sector fell 21% on a current cost basis and 29% on an historic cost basis. Most of the fall in the HC profit rate took place between 1946 and 1965, whereas on a current cost basis it dropped hugely between 1965 and 1982. There was a revival between 1982 and 1997, the neoliberal era, greater on a current cost basis. Since 1997, profitability has declined.

As I have explained before, the closest measure to the Marxian rate of profit requires the use of historic cost measures for fixed assets and depreciation. There is an exaggerated fall and rise in the current cost measure compared to the historic cost measure, due to the current cost inflation of fixed asset prices and depreciation. But the long-term story is the same (see Basu on RC versus HC for the argument that, over a long time, the current costs and historic measures can converge.)
Marx’s law of the tendency of the rate of profit to fall is just that. The rate of profit in a capitalist economy will tend to fall over time and will do just that. BUT there are periods when counteracting factors come into play, so the tendency to fall does not materialise in an actual fall for a period of time. Thus you can get a profit cycle of falling profitability followed by a period of rising profitability and then a new fall, all within a secular process of decline. The US rate of profit in the post-war period exhibits just that with a 32-36 year cycle from trough to trough (for more on this, see my book, The Great Recession).
Marx’s law says that the rate of profit will fall because there will be a rising organic composition of capital (the value of constant capital – machinery, plant and raw materials – will rise faster than variable capital – wages and benefits paid to the employed workforce). The US data confirm that. There is strong inverse correlation (-0.67) between the organic composition of capital and the rate of profit. The organic composition of capital rose 20% from 1946 to 2014 and the rate of profit fell 20%. In the period when profitability rose, from 1982 to 1997, counteracting factors came into play, in particular, a rising rate of exploitation (surplus value) and a cheapening of the value of constant capital that led to a fall in the organic composition. In that period, the rate of surplus value rose 13% and the organic composition of capital fell 16%. I calculate that the rise in the rate of profit from 1980 to 2014 was two-thirds due to a rise in exploitation of labour during the neo-liberal period and only one-third due to cheaper technology. Again this supports Marx’s law.
So in sum, the US rate of profit fell in 2014 for the first time since 2008 and the mass of corporate profits fell in 2014 and went negative in the last quarter. Global corporate profit growth is also slowing significantly. All this suggests that the days (years?) of the economic recovery, such as it is, may be coming to an end. The current economic cycle of boom and slump seems to be about 8-9 years. The trough of the last slump was mid-2009. That would suggest that the next trough would be about 2017-2018. And the peak before the slump is usually 12-18 months before – so about 2016-17.
No comments:
Post a Comment