We now have the latest data from the US Bureau of Economic Analysis (BEA) going up to 2014 in order to work out a ‘Marxian rate of profit’ for the US economy. So I have revisited the data in order to bring things up to date. All the data behind the following graphics are available on request (and see the pdf version for the appendix on sources and methods for each graphic, US rate of profit revisited).
I have not looked at this since the end of 2013, so it is high time to see where the US rate of profit has gone since then and draw some conclusions.
Now how to measure the rate of profit in a ‘Marxian’ way is a matter for continual debate and this post will not go over ground dealt with before. Instead, I refer you my paper on measuring the rate of profit in different ways and also previous posts that deal with this issue.
The main argument over how to measure the rate of profit has been whether to use historic costs (HC) for valuing the stock of fixed assets held by the capitalist sector in an economy or whether it is okay or better to use current or replacement costs. I won’t go into the arguments again – they are covered in the papers and posts already cited.
But it would be interesting to revisit the work of Andrew Kliman (AK) (see his book, The failure of capitalist production) and replicate his way of measuring the US rate of profit with the latest data. This I have tried to do this faithfully in the first graphic here (Figure 1).
Figure 1. US rate of profit (Kliman measure).
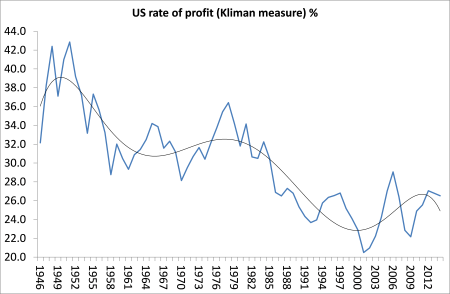
AK’s key arguments were that the US rate of profit since the end of 1945 has ‘persistently fallen’ and that there was no real consolidation or recovery in the so-called neo-liberal period from the late 1970s onwards. The revisited data support those conclusions – except that there appears to be a recovery in profitability from the end of the trough of 2001 up to 2014. Also, on the AK measure, there was a peak in 2006 which has not been breached since, even after the Great Recession ended in 2009. Indeed, the trough of 2001 was not surpassed on the downside by the trough of 2009 in the Great Recession. On the AK measure, US profitability has been stagnating (but no longer falling) at post-war lows since the late 1980s-early 1990s. Or if you like, the US rate of profit is no lower than it was 20 years ago.
The majority of Marxist economists reject the historic cost (HC) measure for the rate of profit (wrongly in my view) and instead use current costs (CC) for the value of fixed assets. How does the current cost measure shape up then? In the second graphic (Figure 2), we can see that there is similar secular fall in the US rate of profit since 1945 but the rate of profit stays high in the 1960s and then plummets to a trough in the early 1980s before consolidating and even rising to the late 1990s. Since 1997, it has been more or less flat at post-war lows, although we see in both measures (HC and CC) that the rate of profit stopped rising in 2012 and has fallen in the last two years.
Figure 2. US rate of profit measures compared
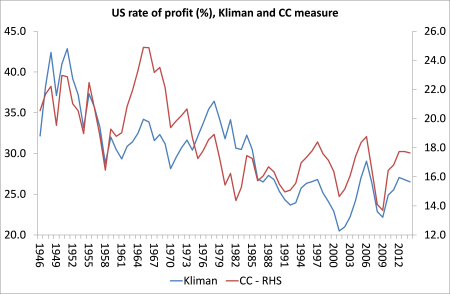
Interestingly, there is little difference in the trajectory of the HC and CC measures from the early 1990s: except that the CC measure goes to a new low in the 2009 Great Recession over the 2001 mild recession and the AK-HC measure does not. But the similar trajectory since the early 1990s could be because the main factor that divides their results, the impact of inflation on fixed assets, has diminished sharply in the last 20 years (see Basu).
Both the above measures look only at the corporate sector and also do not include variable capital in denominator for the rate of profit. I reckon that is better to look at the profitability of the whole economy (not just the corporate sector) to get a better overall picture of profitability (I have presented my arguments for this in the paper already cited above). But also there is no reason to leave out variable capital so that Marx’s traditional measure of profitability (surplus value/constant capital plus variable capital – s/c+v) is sustained. Nearly all Marxist economists reckon that we should drop variable capital in the equation due to issues over the measurement of the turnover of variable capital. I won’t go into the arguments here, but I think that this omission is not necessary. In an unpublished paper G Carchedi and I explain why – here is a short version of that (Measuring variable capital and turnover for the rate of profit).
Anyway, on my measure (using both historic and current costs), the US rate of profit from 1946 to 2014 looks like this (Figure 3).
Figure 3. US rate of profit – whole economy measure
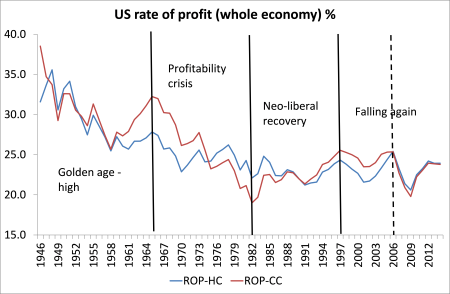
Again, there is a clear secular decline since the end of WW2. On the CC measure there appears to be a ‘neoliberal’ recovery after 1982, but stagnation on the HC measure up to the early 1990s and then a recovery. The recovery on both measures is very mild compared to the fall in the 1970s. There is a peak in 1997 on the CC measure which has not been surpassed since. On the HC measure, the peak is 2006, again not surpassed since. There is a very close movement in the rate of profit on both measures since the 2006 peak and, on both measures, the rate of profit appears to have peaked and fallen back since 2012.
Marx’s law of profitability says that the organic composition of capital (the value of the means of production relative to the value of wages) will tend to rise over time and this tendency explains the tendency of the rate of profit to fall. The major counteracting tendency is a rising rate of surplus value as profits outstrip wages relatively.
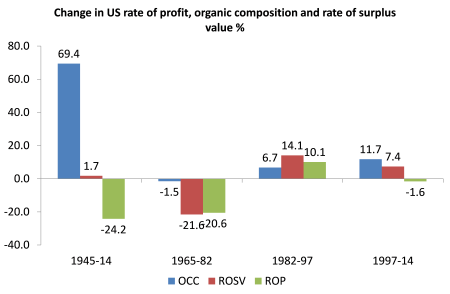
If we break down the composition of the US rate of profit since 1946, Marx’s law is confirmed: the organic composition of capital has risen steadily (with some periods of reversal) and the rate of profit has fallen. The fall is not due to a fall in the rate of surplus value, which has risen during the period. The inverse correlation between the organic composition and the rate of profit is -0.77. That’s higher than the positive correlation between the rate of surplus value and profitability, at +0.60.
If we compare the changes in the rate of profit (ROP) with the changes in the organic composition of capital (OCC) and the rate of surplus value (ROSV), the Marxist story is again confirmed. Between 1945 and 2014, the US rate of profit (whole economy measure) falls 24% while the organic composition of capital rises 69% and the rate of surplus value just 2%. Between 1965 and 1982, when the ROP falls 21%, the OCC falls too by 1.5% and the ROSV falls sharply by 22% (in effect, there is a relative increase in OCC versus ROSV). Between 1982 and 1997 when the ROP rises 10%, the OCC rises nearly 7% and ROSV rises even more by 14%. After 1997, the ROP falls slightly by 1.6%, as the OCC rises faster (11.7%) than the ROS (7.4%).
Figure 4. The change in the US rate of profit (ROP) compared to the change in the organic composition of capital (OCC) and the rate of surplus value (ROSV), %
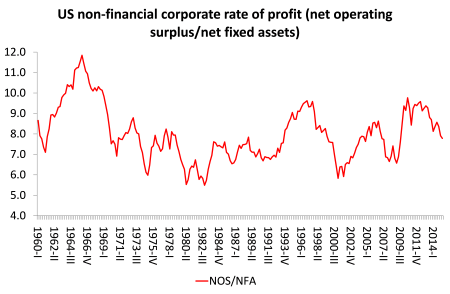
Finally, let us look more closely at what has been happening since the end of the Great Recession in 2009, using the more frequent data on profits and fixed assets provided by the US Federal Reserve. The data are not entirely compatible with the official BEA data used above but it is quarterly in frequency and takes us up to mid-2015. So it has something to tell us.
The Fed measure shows the US rate of profit as the net operating surplus in non-financial corporate businesses (so it excludes the financial sector and the rest of the economy). I’ve measured it against net tangible assets. This is what it shows (Figure 5). There is a recovery in profitability after the early 1980s, but from the late 1990s, profitability has been pretty flat although very volatile. Profitability peaked in 2010 and has been falling since to mid-2015 although it is still higher than in the 1980s. But the movement now is clearly down.
Figure 5. US non-financial corporate rate of profit (Fed measure) %
What can we conclude from all this?
First, the secular decline in the US rate of profit since 1945 is confirmed and indeed, on most measures, profitability is close to post-war lows. Second, the main cause of the secular fall is clearly a rise in the organic composition of capital, so Marx’s explanation of the law of the tendency of the rate of profit to fall is also confirmed. Third, profitability on most measures peaked in the late 1990s after the ‘neoliberal’ recovery. Since then, the US rate of profit has been static or falling. And fourth, since about 2010-12, profitability has started to fall again.
The fall in the rate of profit in the US has now given way to a fall in the mass of profits (Figure 6).
Figure 6. US corporate profits(adjusted for depreciation) % yoy

If this trend continues, then as I have shown elsewhere, investment will follow downwards and, with it, the US economy. Watch this space.
No comments:
Post a Comment