by Michael Roberts
Every year, I analyse the US rate of profit on capital. This is
because the US data is the best and most comprehensive to use and
because the US is the most important capitalist economy, often setting
the scene for trends in global capitalism. We now have the data for
2021 (that’s as far as the official national data go).
There are many ways to measure the rate of profit a la Marx – see http://pinguet.free.fr/basu2012.pdf). I prefer to measure the rate of profit by looking at total surplus value in an economy against total private capital employed in production; to be as close as possible to Marx’s original formula of s/(C+v), where s = surplus value; C = constant capital – which should include both fixed assets (machinery etc) and circulating capital (raw materials and intermediate components); and v = wages or employee costs. My calculations can be replicated and checked by referring to the excellent manual explaining my method, kindly compiled by Anders Axelsson from Sweden.
I call my calculation a ‘whole economy’ measure, as it is based on total national income after depreciation and after employee compensation to calculate surplus value (s); net non-residential private fixed assets for constant capital (so this excludes government, housing and real estate) (C); and employee compensation for variable capital (v). But as said above, the rate of profit can be measured just on corporate capital or just on the non-financial sector of corporate capital. Also profits can be measured before or after tax and the fixed part of constant capital can be measured based on ‘historic cost’ (the original cost of purchase) or ‘current or replacement cost’ (what it is worth now or what it would cost to replace the asset now). And it can also include circulating capital (raw materials and components used in a period of production) in addition to fixed assets (machinery, offices etc).
There used to be a big discussion over which measure of fixed assets to use to get closer to the Marxian view. For an explanation of this debate, see my previous posts and my book, The Long Depression (appendix). Fixed assets can be measured as historic costs (HC) or current costs (CC). The difference is caused by inflation. If inflation is high, as it was between the 1960s and late 1980s, then the divergence between the changes in the HC measure and the CC measure will be greater – see http://pinguet.free.fr/basu2012.pdf. When inflation drops off, the difference in the changes between the two HC and CC measures will narrow. Over the whole post-war period up to 2021, there was a secular fall in the US rate of profit on the HC measure of 27% and on the CC measure 26%. So, for an empirical measure of the rate of profit over a long period, there is nothing to choose between the HC and CC measures.
Most Marxist measures usually exclude any measure of variable capital on the grounds that ‘employee compensation’ (wages plus benefits) is not a stock of invested capital but a flow of circulating capital turning over more than once in a year – and this rate of turnover cannot be measured easily from available data. So most Marxist measures of the rate of profit are just s/C. But some Marxists have made attempts to measure the turnover of circulating capital and variable capital so that these can be included in the denominator, thus restoring Marx’s original formula s/(C+v).
Brian Green has done some important work in measuring circulating capital and its rate of turnover for the US economy, in order to incorporate it into the measure of the rate of profit. He considers this vital to establishing the proper rate of profit and as an indicator of likely recessions. Here is Green’s past post on his method: https://theplanningmotivedotcom.files.wordpress.com/2021/11/1997-2020-various-rates.pdf.
Green’s work is valuable in showing the short-term variations in rates of surplus value and profit caused by changes in circulating capital. Green considers these short-term variations as an important indicator of the cycles of boom and slump in a capitalist economy. But they do not alter significantly the longer-term trends in the rate of profit. If you include circulating capital and variable capital in the measurement of the rate of profit, this will make a difference to the level of the rate of profit, but not much difference to the trend and turns in the rate of profit since 1945.
I used to make my own annual calculations for the US rate of profit for the whole economy and for the corporate sector alone. But we can now use the excellent database produced by Deepankur Basu and Evan Wasner (https://dbasu.shinyapps.io/Profitability/) for the corporate sector only, which is similar to my method of measuring the rate of profit. So I have replicated their results and highlighted where the rate of profit fell and rose. The Basu-Wasner measure excludes variable capital from the denominator. You can include it using their database, but it makes little difference to trends and turning points in the rate of profit since 1945. The graph below shows the US rate of profit in the corporate sector up to 2021.
The first thing to notice is that Marx’s law of the tendency of the
rate of profit to fall is confirmed by the trend in the US rate of
profit. This has fallen 27% over the period 1945-2021. We can also
discern the huge fall in profitability from 1965-82 from 23.2% to
13.5%. And we can identify a recovery during the so-called neo-liberal
period from 1982 to 17.5% in 2006. After that, the rate of profit falls
gradually, but in a series of booms and slumps, in what I call the
period of the Long Depression, to 16.3%.
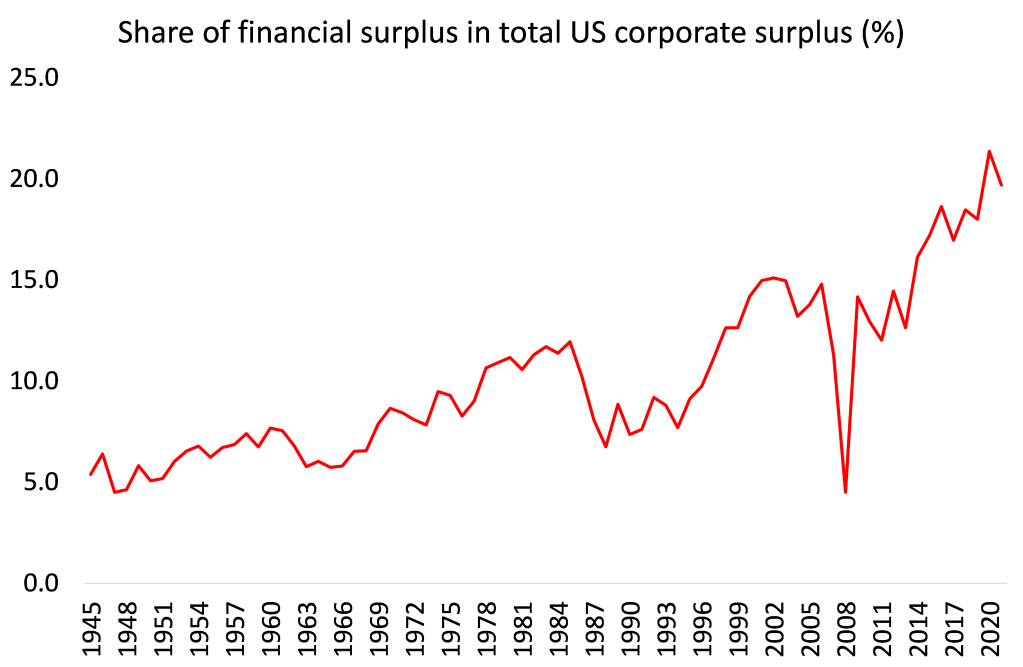
What you also notice from this measure is that the US corporate rate of profit rose from 1982 up to a peak in 2006. So it could be argued, as some have done, that Marx’s law cannot be the underlying cause of the Great Recession in 2008-9 if the US rate of profit was reaching a 25-year high in 2006. But if we look just at the non-financial corporate sector (NFC), a proxy for what we might call the ‘productive’ part of the capitalist economy (where workers create new value for capitalists), then it is a different story. In Marxian value theory, the financial sector does not create new value; it takes a cut from the profit extracted from labour in the non-financial (productive) sector. And it is the rise in financial sector profits particularly since 1997 that distorts the corporate rate of profit up to 2006 (see graph below).

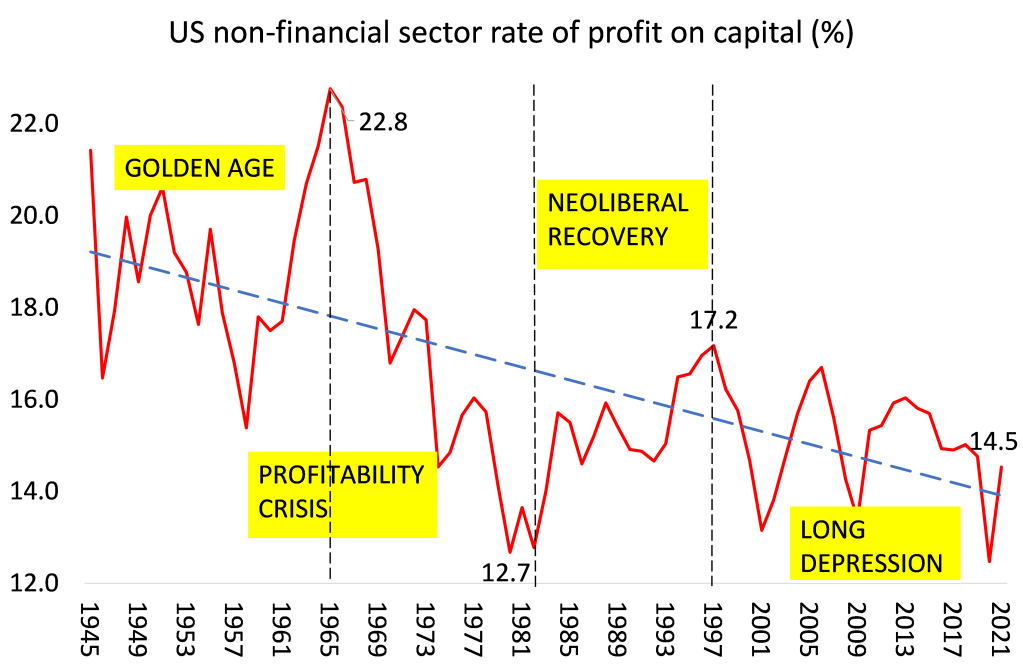
So looking at NFC profit rate is more relevant to the underlying health of the US capitalist economy. When the rise in financial profits is taken out of the data, we find that non-financial sector profitability peaked much earlier than 2006; instead back in 1997.

What the NFC graph also shows is that there has been a secular fall in the US rate of profit on non-financial capital over the last 75 years – a la Marx. Basu-Wasner calculate the average annual fall in the rate of profit at -0.42%. Between 1945 and 2021, the NFC rate of profit fell 32%.
In the so-called ‘golden age’ of post-war US capitalism, the NFC rate of profit was very high, averaging over 20%, rising 6% from 1945-1965. But then came the profitability crisis period between 1965 and 1982, when the rate of profit fell 44%. This provoked two major slumps in 1974-5 and 1980-2 and led to the strategists of capitalism trying to restore the rate of profit with the ‘neoliberal’ policies of privatisation, the crushing of unions, the deregulation of finance and globalisation from the early 1980s onwards.
The ‘neoliberal’ period of 1982-97 saw the rate of profit in the non-financial sector rise by 34%, although at the 1997 peak, the rate was still below the average in the Golden Age. Then came a new period of profitability crisis, which I have dubbed the Long Depression. In this period, which includes the Great Recession of 2008-9 and, of course, the COVID slump of 2020, the rate of profit fell 15%. In 2020, the US rate of profit in its non-financial sector reached a 75-year low, but recovered in somewhat 2021, but still below the pre-pandemic rate in 2019.
This brings us to the causes of the changes in the rate of profit. According to Marx, changes in profitability depend primarily on the relative movement of two Marxian categories in the accumulation process: the organic composition of capital (C/v) and the rate of surplus value or exploitation (s/v). If C/v outstrips s/v, the rate of profit will fall, and vice versa.
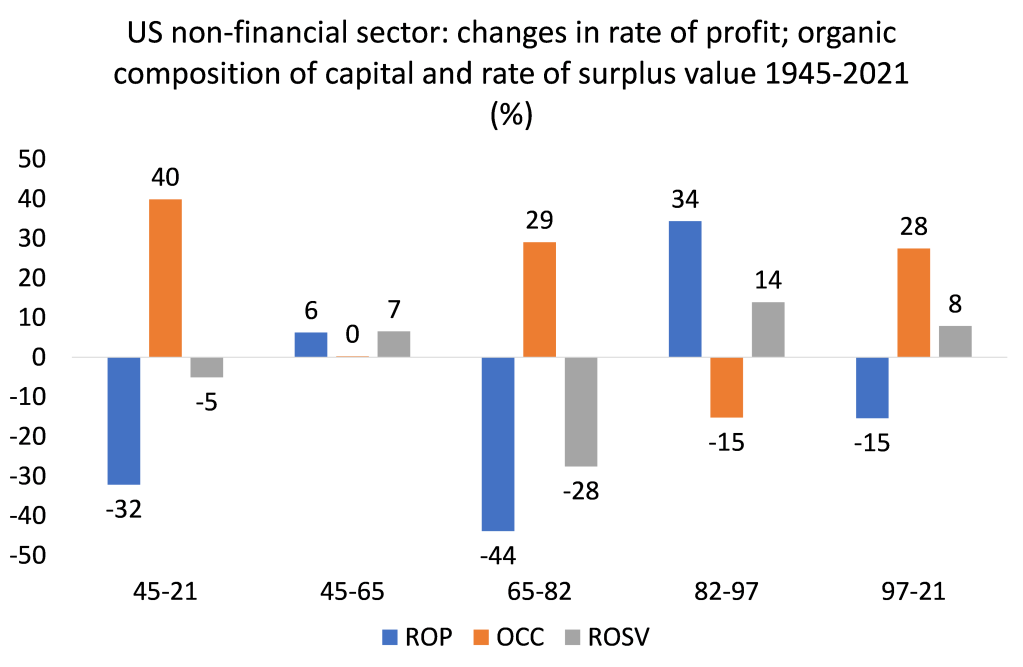
On the Basu-Wasner current cost measure, since 1945, there has been the secular rise in the organic composition of capital (OCC) of 40%, while the main ‘counteracting factor’ in Marx’s law of the tendency of the rate of profit to fall, the rate of surplus value (ROSV), fell slightly by 5%. So the rate of profit fell 32% from 1945 (see graph below).

In the profitability crisis of 1965-82, the NFC rate of profit fell 44% as the organic composition of capital (OCC) rose 29% and the rate of surplus value (ROSV) fell 28%. Conversely, in the so-called ‘neo-liberal’ period from 1982 to 1997, the rate of surplus value rose 14%, while the organic composition of capital fell 15%, so the rate of profit rose 34%. Since 1997, the US rate of profit has fallen around 15%, because the organic composition of capital has risen 28%, outstripping the rise in the rate of surplus value (8%). In other words, in the first two decades of the 21st century US non-financial sector capitalists exploited the workforce even more, but not enough to stop the rate of profit falling. So Marx’s law of profitability is confirmed by the results in each of these periods, as it is for the whole period of 1945-2021.
I have argued in many places that the profitability of capital is key to gauging whether the capitalist economy is in a healthy state or not. If profitability persistently falls, then eventually the mass of profits will start to fall and that is the trigger for a collapse in investment and a slump. And one of the compelling results of the data is that each post-war economic recession in the US has been preceded by (or coincided with) a fall in the rate of profit and by a slowdown in profit growth or an outright fall in the mass of profits. This is what you would expect cyclically from Marx’s law of profitability. The Great Recession and the pandemic slump of 2020 were preceded (or accompanied) by particularly sharp falls in profitability and profits growth.

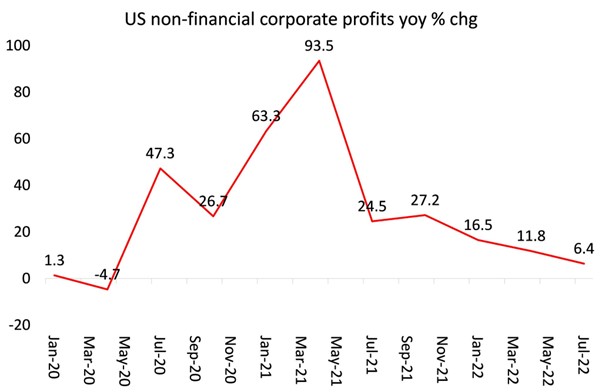
It now looks very likely that by the end of this year, 2022, the major economies will be entering a new slump, just three years after the pandemic slump of 2020. US corporate profits fell in Q3 2022, according to the latest released data. Indeed, non-financial corporate profits fell nearly 7% on the quarter. US corporate profits slowed to 4.4% yoy from 7.7% yoy in Q2 and sharply from peak yoy growth of 22% at the end of 2021. Non-financial profits have slowed to 6.4% yoy.

A profits contraction has started as wages, import prices and interest costs are now rising faster than sales revenue. Profit margins (per unit of output) have peaked (at a high level) as unit non-labour costs and wage costs per unit are rising and productivity stagnates. The post-pandemic profits bonanza is over. When we get full data for 2022 corporate profitability, expect it to have fallen again as we enter a new slump in the US in 2023.
No comments:
Post a Comment