The latest data for net fixed assets in the US have been released, enabling me to update the calculations for the US rate of profit a la Marx up to 2016.
Last year, I did the calculations with the help of Anders Axelsson from Sweden, who not only replicated the results to ensure their accuracy (and found mistakes!), but also produced a manual for carrying out the calculations that anybody could use.
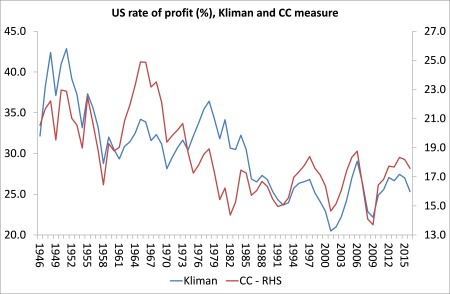
As I did last year and in previous years, I have also updated the rate of profit using the method of calculation by Andrew Kliman (AK) that he first carried out in his book, The failure of capitalist production. AK measures the US rate of profit based on corporate sector profits only and using the BEA’s historic cost of net fixed assets as the denominator.
I also calculate the US rate of profit with a slight variation from AK’s approach, in that I depreciate gross profits by current depreciation rather than historic depreciation as AK does, but I still use historic costs for net fixed assets. The theoretical and methodological reasons for doing this can be found here and in the appendix in my book, The Long Depression, on measuring the rate of profit.

The results of the AK calculation and my revised version are obviously much the same as last year – namely that AK’s measure of the rate of profit falls persistently from the late 1970s to a trough in 2001 and then recovers during the credit-fuelled, ‘fictitious capital period’ up to 2006. The 2006 peak in the rate is higher than the 1997 one. My revised version of AK’s measure shows a stabilisation of the profit rate at the end of the 1980s, after which profitability does not really rise much (although there are various peaks up to 2006). What the new data for 2016 do reveal, however, is that profitability (on both measures) has remained below the peak of 2006 (i.e. for the last ten years) and has fallen for the last two. And, of course, the long-term secular decline in the US rate is confirmed on both measures, some 25-30% below the 1960s.
But readers of my blog and other papers know that I prefer to measure the rate of profit a la Marx by looking at total surplus value in an economy against total productive capital employed; so as close as possible to Marx’s original formula of s/c+v. So I have a ‘whole economy’ measure based on total national income (less depreciation) for surplus value; net fixed assets for constant capital; and employee compensation for variable capital. Most Marxist measures exclude a measure of variable capital on the grounds that it is not a stock of invested capital but circulating capital that cannot be measured from available data. I don’t agree and G Carchedi and I have an unpublished work on this point. Indeed, even inventories (the stock of unfinished and intermediate goods) could be added as circulating capital to the denominator for the rate of profit, but I have not done so here as the results are little different.
Updating the results from 1946 to 2016 on my ‘whole economy’ measure shows more or less the same result as last year, as you might expect. I measure the rate in both historic and current cost terms. This shows that the overall US rate of profit has four phases: the post-war golden age of high profitability peaking in 1965; then the profitability crisis of the 1970s, troughing in the slump of 1980-2; then the neoliberal period of recovery or at least stabilisation in profitability, peaking more or less in 1997; then the current period of volatility and eventual decline. Actually, the historic cost measure shows no recovery in the rate of profit during the neoliberal period. The current cost measure always shows much greater upward or downward movement. On this measure, the post-war trough was in 1982 while on the historic cost measure, it is 2009 at the bottom of the Great Recession.

What is new about the 2016 update is that the US rate of profit fell in 2016, after a fall in 2015. So the rate of profit has fallen in the last two successive years and is now 6-10% below the peak of 2006.
One of the compelling results of the data is that they show that each economic recession in the US has been preceded by a fall in the rate of profit and then by a recovery in the rate after the slump. This is what you would expect cyclically from Marx’s law of profitability.

In a recent paper, G Carchedi identified three indicators for when crises occur: when the change in profitability; employment; and new value are all negative at the same time. Whenever that happened (12 times since 1946), it coincided with a crisis or slump in production in the US. This is Carchedi’s graph.

My updated measure for the US rate of profit to 2016 confirms the first indicator is operating. The graph above shows that in the last two years there has been a 5%-plus fall. However, new value growth is slowing but not yet negative; and employment growth continues. So on the basis of these three (Carchedi) indicators, a new recession in the US economy is not imminent. Also the mass of profit or surplus value rose (if only slightly) in 2016, and so again does not provide confirmation of an imminent slump.
What the updated data do confirm is my guess last year that 2016 would show a fall in the US rate of profit – and by all the measures mentioned. And, of course, Marx’s law of profitability over the long term is again confirmed. There has been a secular decline in US profitability, down by 28% since 1946 and 15-20% since 1965; and by 6-10% since the peak of 2006. So the recovery of the US economy since 2009 at the end of the Great Recession has not restored profitability to its previous level.
Also, the driver of falling profitability has been the secular rise in the organic composition of capital, which has risen nearly 20% since 1965 while the main ‘counteracting factor’, the rate of surplus value, has fallen 4%. Indeed, even though the rate of surplus value has risen 5% since 1997, the rate of profit has fallen 5% because the organic composition of capital has risen over 12%.

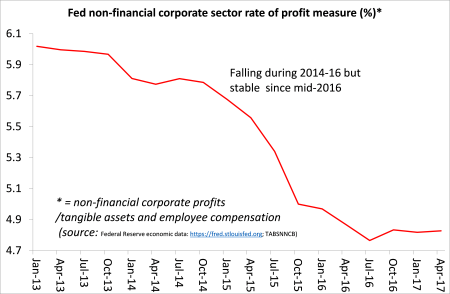
Has the US rate of profit slowed further in 2017? We can use quarterly data from the US Federal Reserve on the non-financial corporate sector to get a rough idea. The Fed data suggest that the rate of profit in the first half of 2017 was flat at best.

So, if the rate of profit is a good indicator of an upcoming slump in capitalism, then the jury is out on the likelihood of slump in 2018. However, the rate of profit is still down from its peaks of 1997 and 2006 and now appears to be flat lining at best.
No comments:
Post a Comment