US – still crawling
by Michael Roberts
The US
released its figures of real GDP growth in Q4’2012. Against all
economic forecasts (the consensus had been for a 1.1% rise), real GDP
fell 0.1% at an annualised rate in Q4 2012 after increasing 3.1% in Q3.
It was the first quarterly contraction since the Great Recession ended
in mid-2009.
However, this could all be revised. And the
detail of the GDP release shows that things are not as bad as the
headline figure suggests. The quarterly decline was mainly due to a
sharp drop in inventories. Companies usually produce more to stock up
in case of a rush in demand. But in the last quarter they did the
opposite and cut back on stocks. The reason was probably a worry that
the US Congress was about to unleash a severe austerity package (the
so-called fiscal cliff) that would hit consumer spending, and thus
sales, hard. So they cut back on stock building. Also, government
spending on defence dropped sharply, possibly because the troops are
starting to come back from Afghanistan and Iraq. And US exporters
failed to deliver enough sales to boost growth – see the graph below for
a breakdown of the GDP.
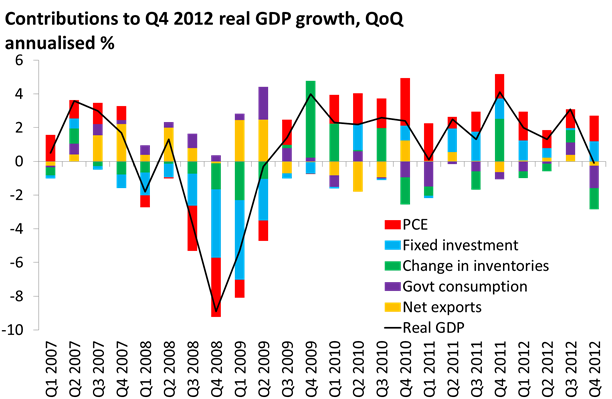
Moreover, in Q4 the private
domestic sector of the US economy did better. Real personal consumption
expenditures were up 2.2% (annualised) in Q4 compared to 1.6% in Q3.
And residential investment (property purchases) were up by an annual
rate of 15.3% qoq compared 13.5% in Q3 – so the US housing market is
making a recovery from very low levels. Most important of all, real non
residential fixed investment was up to an 8.4% annual rate from a
contraction of 1.8% in Q3. So it would appear that corporate
investment in new equipment picked up.
But it would be misleading to conclude from this that the main productive sector of US capitalism was beginning to expand faster. The figure below (from Doug Short) shows that while personal consumption as a share of US GDP is near its all-time high of 71% (blue line), private investment (both in property and productive equipment and plant) is still well below its peak before the crisis, and as a share of GDP is only at the level of 1996 (red line).

Indeed, if you isolate productive investment only, the latest quarterly figure suggests a slowing of growth on a year-on-year basis.

If we look at the annual growth figures for real GDP, the picture emerges of an economy that contracted by over 3% in 2008 and 2009 and then recovered to trundle along at an average of almost exactly 2% a year for the last three years, even slower than the very poor 2.6% a year achieved between 2002-07 in the credit boom.
And this Q4 figure, if confirmed in subsequent revisions, shows that the growth rate is struggling to get above 2% and may even get slower. That does not auger well for getting unemployment down much, as that requires a real GDP growth rate of 3%-plus a year.

The US economy is doing better than the UK, Japan or Europe. But it is still crawling.
No comments:
Post a Comment